Huyen Vu (she/her/her)
Data Analyst

About Me
Hi! My name is Huyen (Hwen) Vu. I'm a Mathematical Data Science student at the University of Houston with a background in Statistics, Computer Science, Programming and Digital Media Marketing. I'm a driven individual who's always seeking new opportunities to learn and grow both academically and professionally.
Always happy to make new connections and help where I can. Email me if you have any questions.😊
Education & Activities
Education
Expected
graduation
12/2024
Bachelor of SCIENCE IN Mathematical- Data Science
University of Houston
Houston, Texas
Activities
07/2024 – Present
Houston Area SQL Server User Group - Member
02/2024 – Present
UH Bauer SPO - Member
01/2023 – Present
UH Cougar AI - Member
Volunteer
Promotional Media Coordinator
01/2023 - 05/2023
IUCRC BRAIN Center
- Developed and implemented engaging content for branded websites, LinkedIn, Facebook, and Instagram platforms to increase digital exposure by 35%
- Created social media content in collaboration with content team resulting in 25% growth in social media following
- Monitored and analyzed social media performance using analytics tools and made data-driven decisions to improve engagement
Skills & Proficiencies
tECHNICAL sKILLS
Python, SQL, RStudio
Copywriting/Editing
Content creation and marketing
Strategic Planning
lANGUAGES
American English
Vietnamese (Native)

DAshBoard
The dashboard provides industry survey data on salary ranges, education levels, job satisfaction, and geographic distribution for data professionals.
Students can utilize this information to grasp the necessary skills, salary expectations, and satisfaction of a career in data science.
Click on the “…” and choose to enter full screen

An Analysis on World Energy

A report highlights the regions that consume and produce the most energy from 1990 to 2020, offering insights into global energy markets and their environmental impacts over the last three decades.
Data set: Kaggle's World Energy Yearbook (1990-2020) includes 1,364 observations with 21 variables.
Variables: response variable-Region and three predictors: total energy production, consumption, and CO2 emissions
Model used: The K-Nearest Neighbors (KNN)
Validation methods: Cross-Validation, Leave-One-Out Cross-Validation, and K-fold Cross-Validation.
Language : R
Region:
Africa North America
Middle east Asia & Pacific
Arab States South/Latin America
Europe
Middle east
North America
South/Latin America
Full report

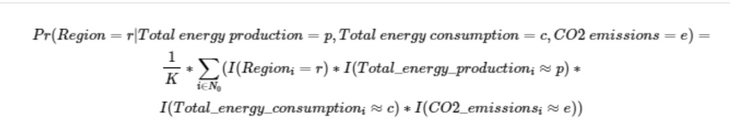
Summary Analysis on World Energy
Model Formula:
Cross-Validation:
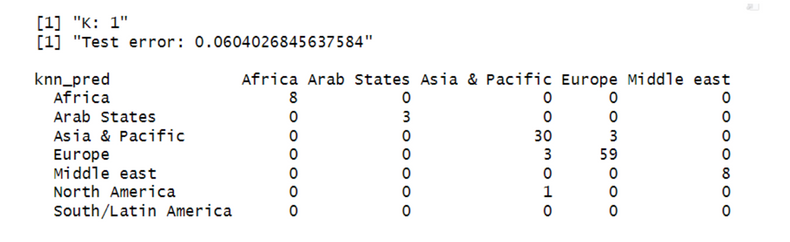
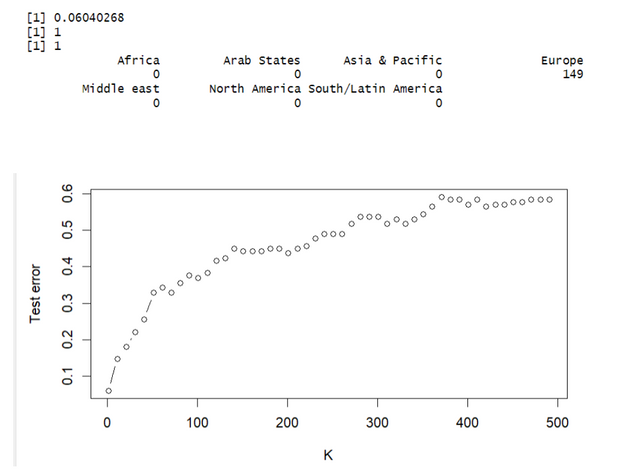
The KNN model was trained with K values ranging from 1 to 500 in increments of 10. Each K value was evaluated based on test error, with K=1 achieving the lowest error rate of 0.0604. The model predominantly predicted the "Europe" region, accounting for 149 instances.
Method: The dataset was randomly split into training and validation sets using an 80-20 split with a seed of 123. The KNN model was then trained for K values ranging from 1 to 10 to identify the K value that minimized the error rate.
Results: K=1 is the optimal number of neighbors. This value yielded the best performance metrics for the model.This low error rate signifies that the model can accurately classify more than 93% of the data points.
Analysis of Delaware Real Estate
This report examines how house size (including square footage, lot size, number of bedrooms, and number of bathrooms) varies by ZIP code, and explores the relationship between house size and price, providing insights into real estate trends and market dynamics across different zip code of Delaware.
Data set: Kaggle's USA Real Estate includes 2K listings of Delaware with 6 variables
Model used: MANOVA, PCA, and Multiple Linear Regression
Language : R
Full report
Web Design
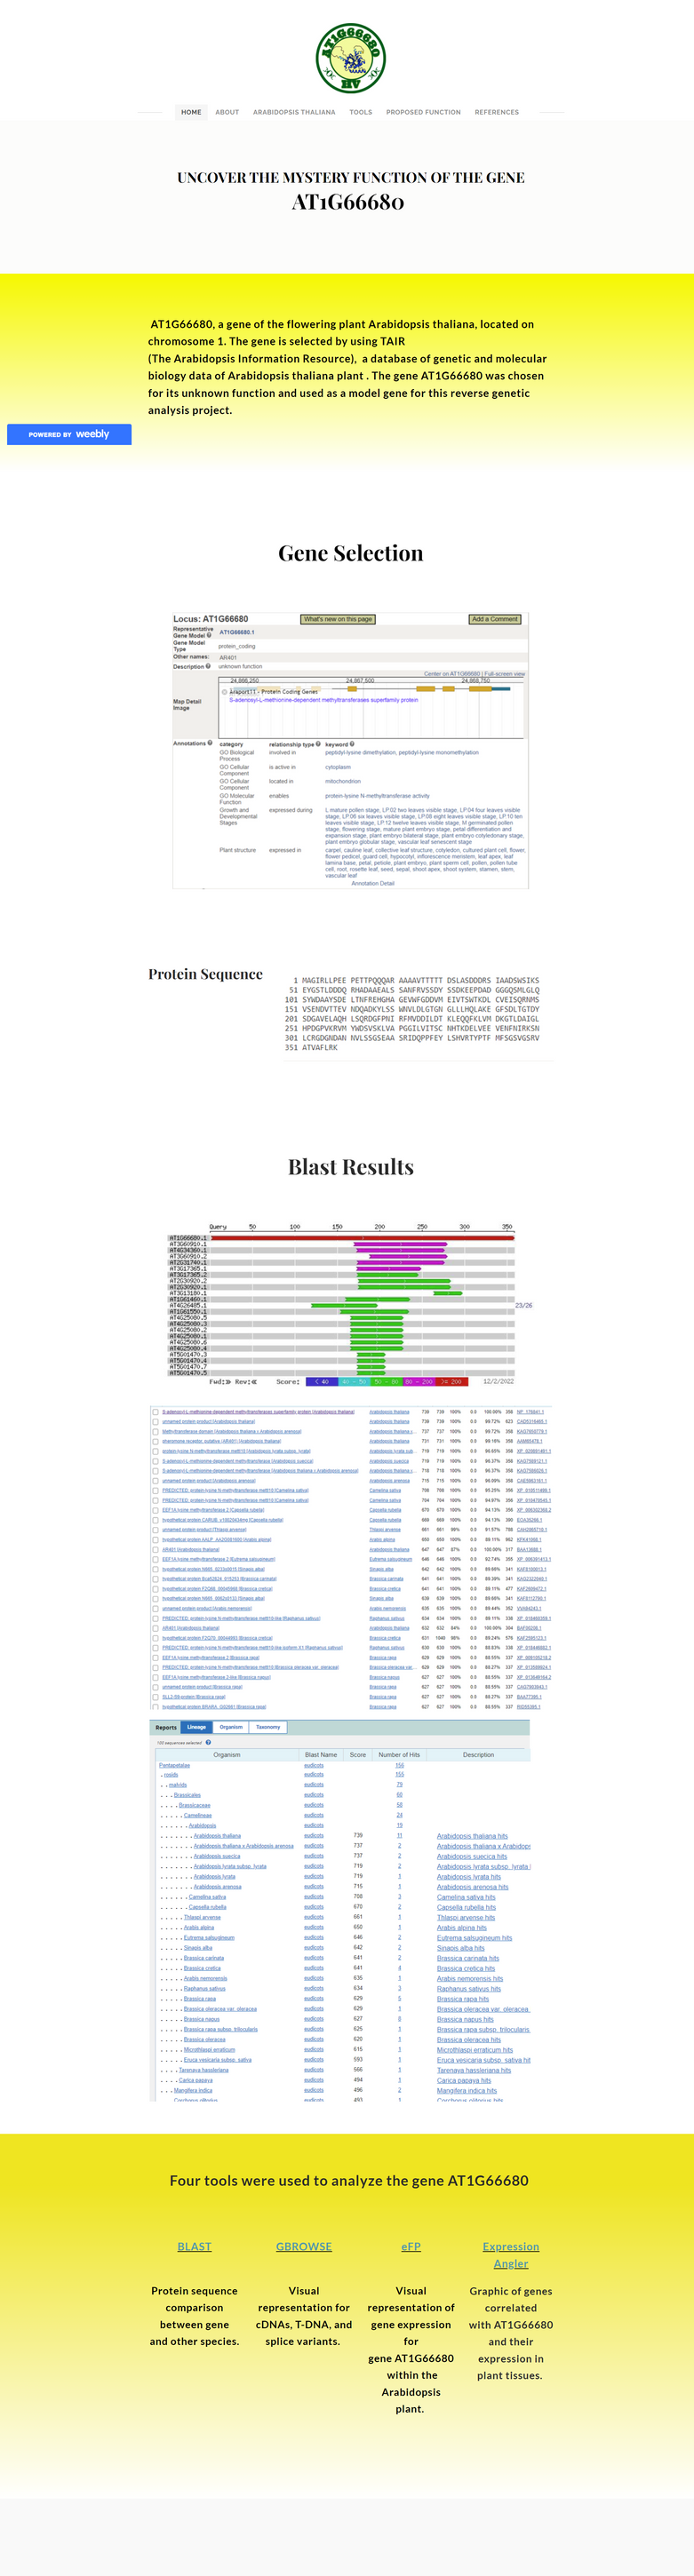
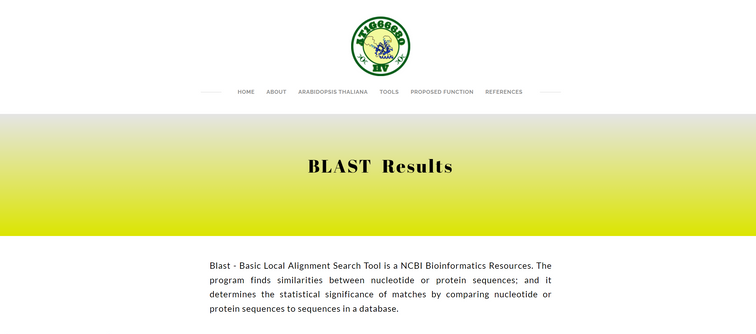
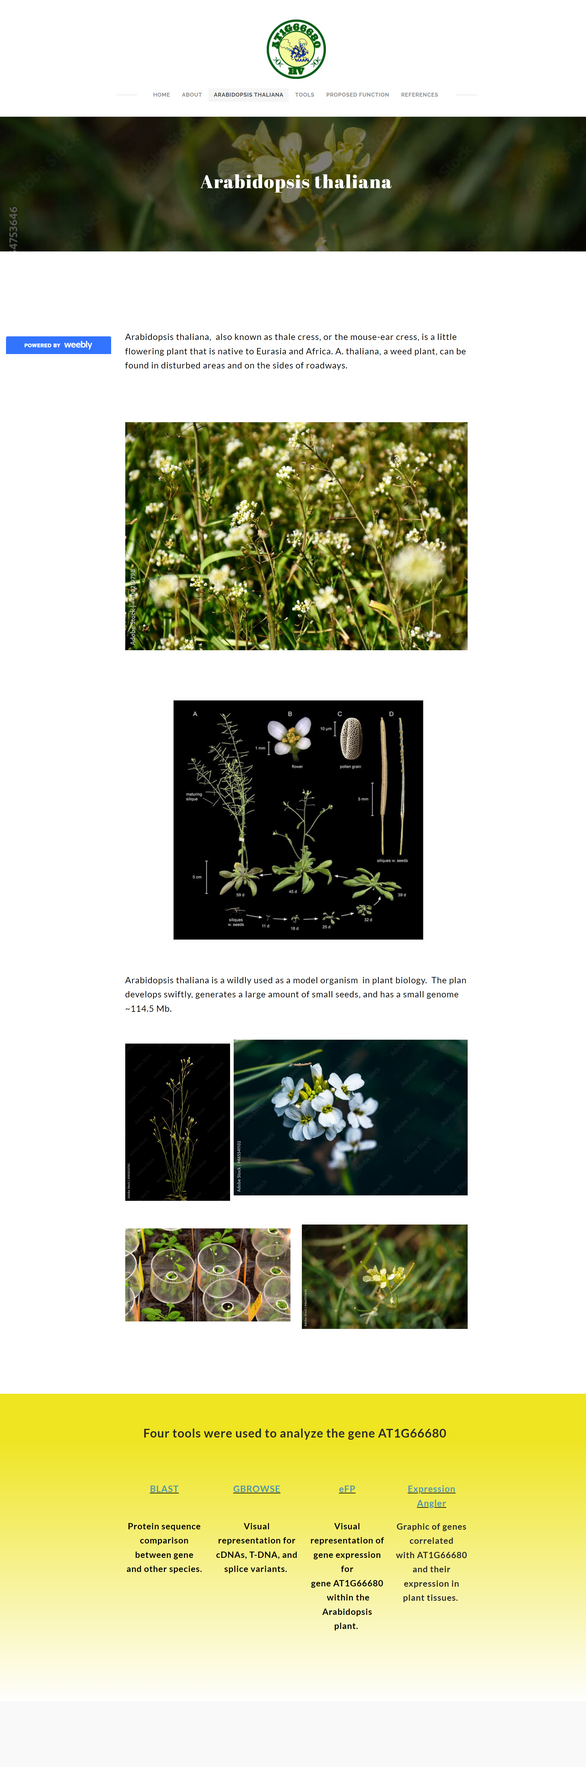
A website showcases the findings of a reverse genetic analysis project investigating the function of the AT1G66680 gene in Arabidopsis Thaliana.
#Weebly #UX #Canva #ContentCreation #Design
Built in Weebly, and designed using Canva. The layout is optimized for an exceptional user experience, with an easy-to-navigate interface that presents findings in a clear, concise, and visually appealing manner.
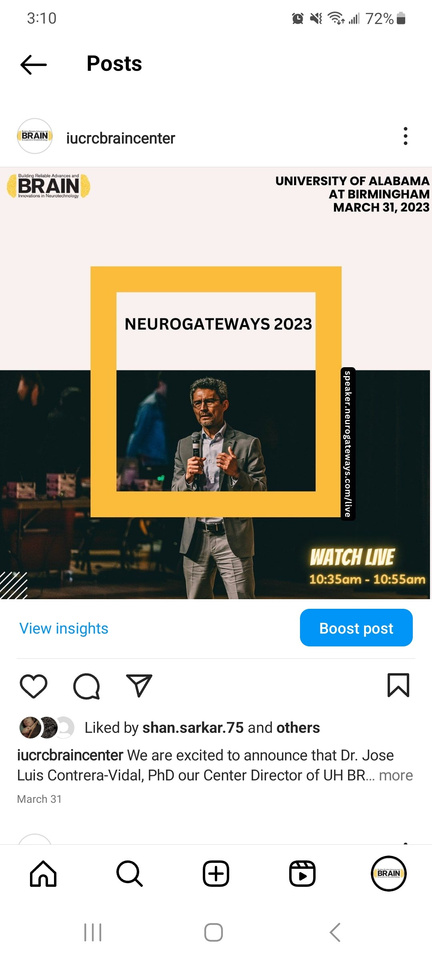
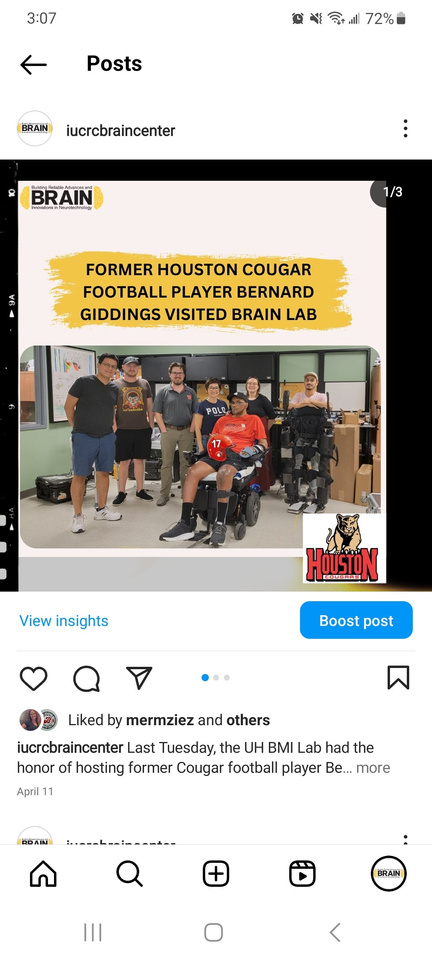
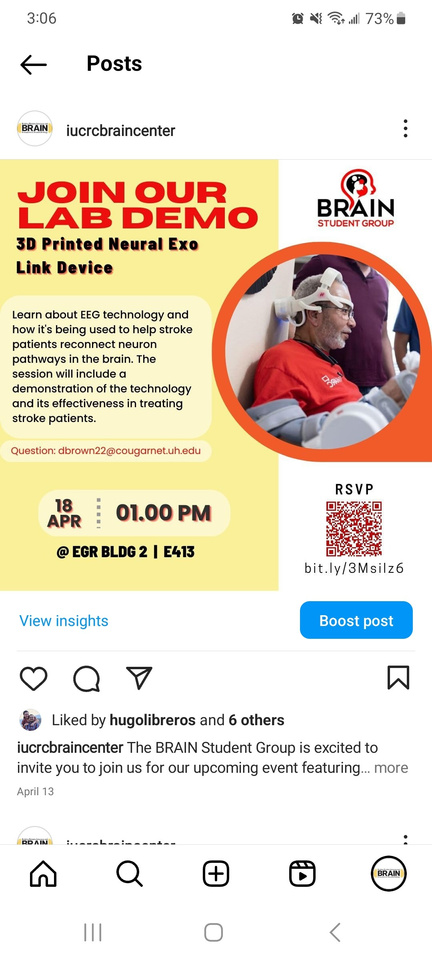
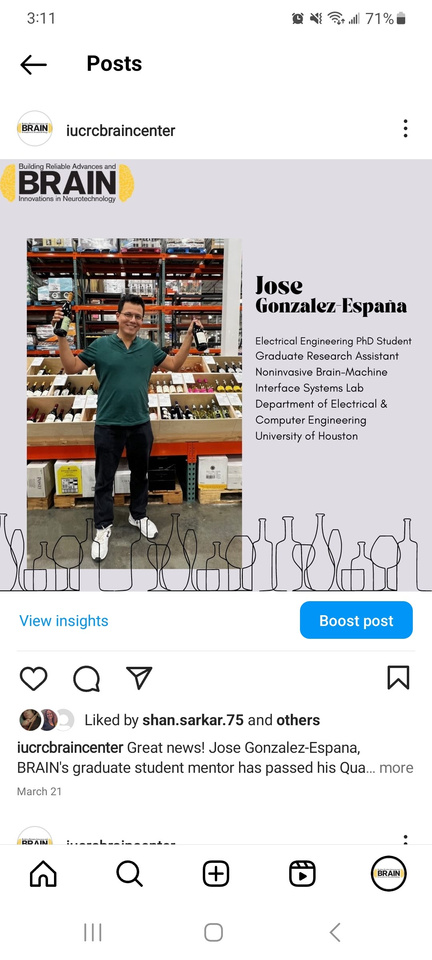
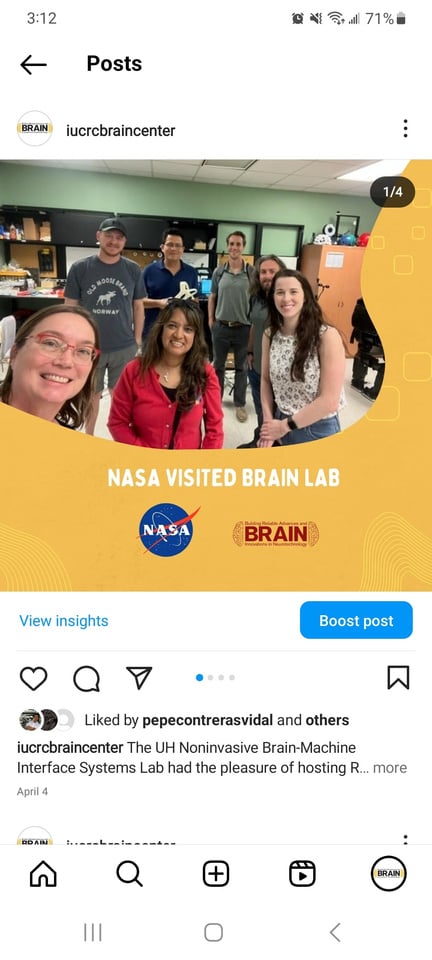
SOCIAL MEDIA management
@iucrcbraincenter


@iucrcbraincenter's content and social media campaigns aim to engage industry innovators, academic teams, and government leaders by showcasing the innovative research conducted within their organization. The goal is to inspire young researchers and students in STEM fields while strengthening relationships with followers and driving conversions.
DIGITAL + eMAIL
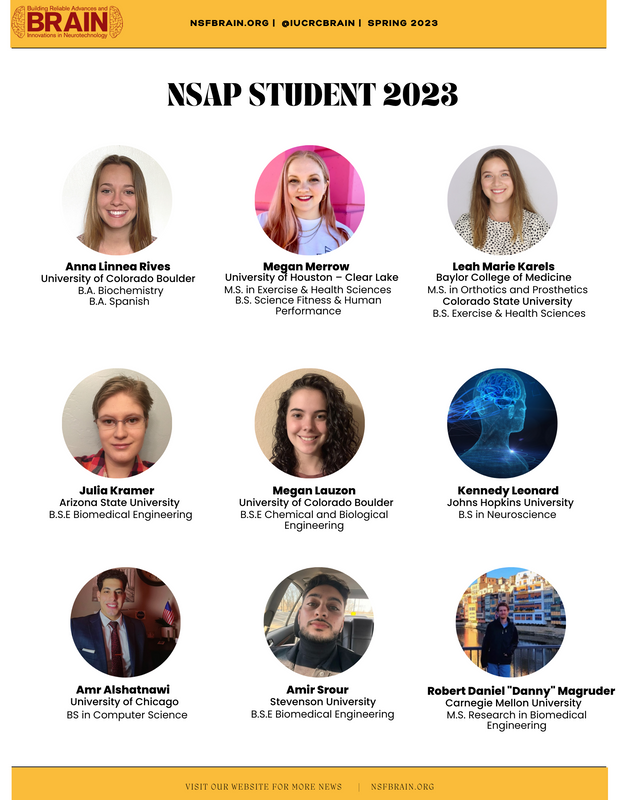
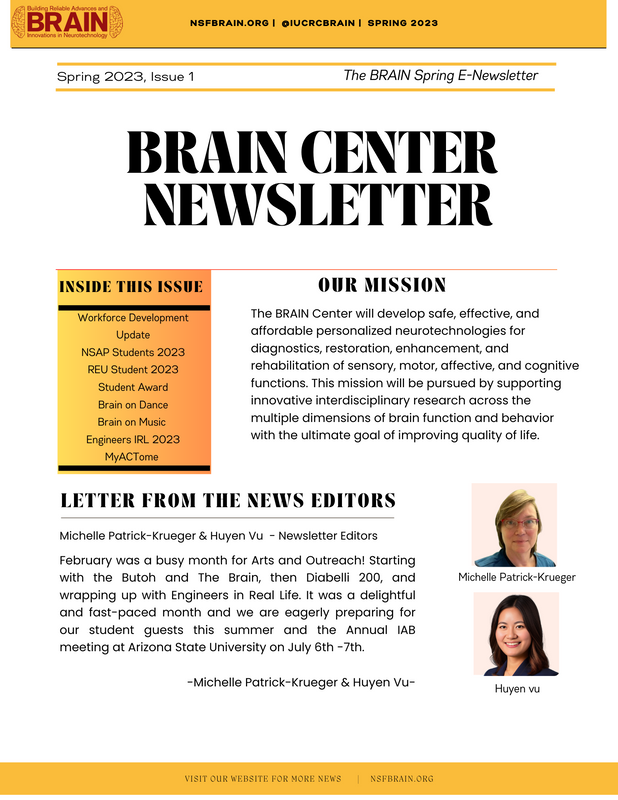
The NSF Brain Center Newsletter, Spring 2023 Issue 1, aims to update its readers on the recent research progress, upcoming events, and various activities conducted by the center. The newsletter features articles, interviews, and news about the latest outreach events, workforce development and achievements of BRAIN members.
#Canva #EmailMarketing #EmailDesign #html #MailChimp
Designed using Canva. The layout features a clean, uncluttered design with consistent branding elements and an optimized color scheme that provides an exceptional user experience. The easy-to-navigate interface presents findings in a clear, concise, and visually appealing manner